The Synthetic Dataset
This page describes what the dataset represents, and how it was produced, including the assumptions made and the sources of underlying data.
Contents
Scope
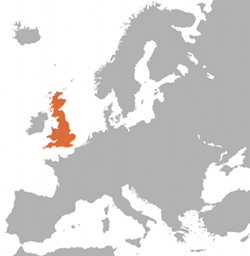
Great Britain highlighted on a map of Europe. The three countries within Great Britain - England, Scotland and Wales - are provided with electricity
by the National Grid. This includes the isles of Orkney and Shetland, but not the Isle of Man and other crown dependencies.
Licence: Public Domain, via Wikimedia Commons
The dataset is a collection of demand data along with two renewable energy technologies which can potentially play a key role in the future energy scenario.
- Electricity demand, the total power required at a given moment to operate all devices using electricity that are 'plugged in' to the National Grid, either in consumers' homes, in factories or in street lighting and other applications
- Wind power production, the total power produced at a given moment by wind turbines distributed across the country
- Solar power production, the total power produced at a given moment by five independent photovoltaic power production facilities distributed across the country
Resolution
The resolution of the data provided is 15 minutes. There are 35,040 values (each representing a 15 minute period in 2025) across 4 columns, forming a 140,160 element matrix. The values are in order, forming a time series from 00:00 on January 1st 2025 to 23:45 on December 31st 2025.
Demand
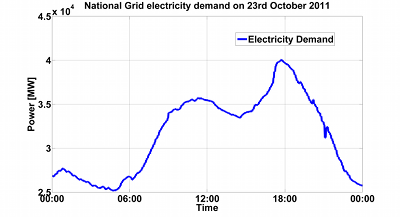
National Grid demand on 23/10/2011. Demand increases in the morning, before dipping slightly in the afternoon and then increasing to its maximum at around
18:00. After this point, demand drops gradually until around midnight. A slight spike occurs shortly after midnight, as low-tier
Economy 7 tariffs take effect.
Data source: National Grid
The underlying data is provided by the National Grid on their website, in megawatts (MW).
Demand in Great Britain follows a reasonably predictable shape throughout each day, with a morning spike, an afternoon saddle and an evening spike around 18:00. Demand gradually decreases after this point until around midnight where it remains low until the next morning. At the weekend, demand is lower but follows a similar pattern.
Wind
As a conservative estimate, we have used Irish wind farm production data as a basis for the wind power information, as the fluctuations in wind speeds are at least the same if not greater in magnitude than those found in Great Britain. The Irish grid operators, EirGrid, make available a facility to obtain Irish wind power production information, with 15 minute resolution, via their website.
In Ireland in 2011, the installed capacity of wind turbines was approximately 1.5GW. The average wind power produced throughout the year in Ireland was 485MW, representing a capacity factor of just over 30%. This is similar to the estimate made by David MacKay for the United Kingdom in his book, Without the Hot Air.[1] Seeing as Ireland shares much of the same weather patterns as Great Britain, we have used the Irish wind power production data for 2011 as a basis for our own dataset. The rate of change between adjacent values in the Irish data has been left unmodified, but the power outputs have been scaled so as to, on average, represent 50% of the total British power requirement for 2025. This requires that the individual Irish power output values across the full year are each multiplied by a factor of approximately 36. This results in an average output of about 17GW, which is roughly half of average British power demand, as intended.
Solar
The solar power data was generated using real solar data provided by the Met Office. To estimate the effect and frequency of effects that clouds have on sunlight reaching the ground, Met Office data for Glasgow was compared against a model of the 'clear sky' irradiance -- that is, to say, the irradiance at ground level from the Sun without the effect of clouds and other atmospheric effects -- incident upon Glasgow.
Clear Sky Irradiance Model
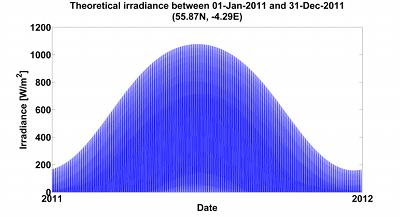
Theoretical Sun irradiance incidence on Glasgow (coordinates: 51.485018N, -3.179569E) across 2011, according to the Loughborough model. Each data point represents 2.4 hours. The irradiance is highest in summer, when the Northern Hemisphere is tilted towards the Sun, and it is lowest in winter when the Northern Hemisphere is tilted away from the Sun.
The model used to calculate the irradiance of the Sun in Glasgow was developed by Ian Richardson and Murray Thomson of Loughborough University's Centre for Renewable Energy Systems Technology in their paper "Domestic electricity use: a high-resolution energy demand model".[2] This paper involved the development and use of a solar model which uses the extraterrestrial solar constant, along with factors to compensate for day of year, atmospheric refraction and Sun position, to calculate the total power incident on a piece of ground at a given set of coordinates. An macro-enabled Excel spreadsheet accompanying the article is available here.
Met Office Irradiance Data
The Met Office provided hourly Glasgow sunlight irradiance measurements for 2011. As this data was measured from a sensor at ground level, it already included the full effects of clouds, atmospheric refraction and other factors preventing the full irradiance from the Sun reaching the ground.
Atmospheric Attenuation
Using the coordinates for Glasgow (55.871811N, -4.291798E), the 'clear sky' irradiance was calculated using the Loughborough model. The Met Office's sensor data was then divided by the 'clear sky' model's prediction for the irradiance at that time, to provide an attenuation factor between 0 and 1 of how much of an influence the atmosphere had on the sunlight reaching the ground.
In addition, the rate of change of these attenuation factors was also calculated. This is useful for showing how quickly atmospheric attenuation factors, such as clouds, come and go. This is important to know, because without taking account of such information it could be entirely possible for the model to predict frequent periods of completely overcast skies followed by complete clear skies. A more realistic model would clearly involve a slower transition between the two extremes.
-
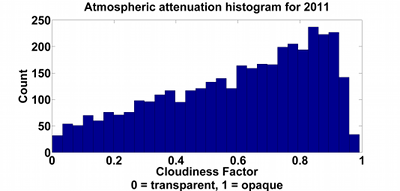
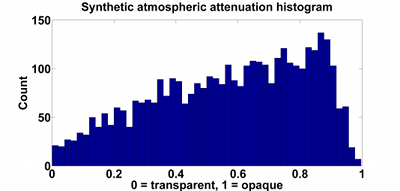
Histogram of atmospheric attenuation between 'clear sky' model and real Met Office Glasgow irradiance data. The 'cloudiness' -- the fraction of the extraterrestrial Sun irradiance absorbed by the clouds -- is a gradual slope towards complete absorption, showing that higher attenuations are favoured over lower ones, except for factors above around 0.9 where far less measured attenuations were present.
-
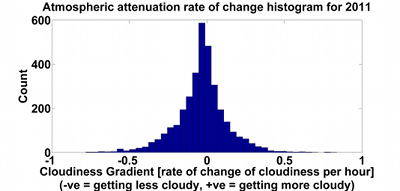
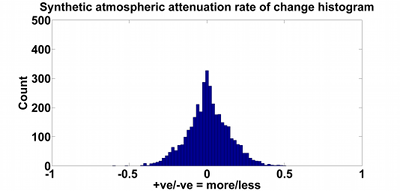
Histogram of the rate of change of the atmospheric attenuation shown in a histogram to the left. This shows that the rate at which the sky becomes more cloudy is very similar to the rate at which the sky becomes less cloudy.
Creation of Synthetic Data
The calculated attenuation and rate of change of attenuation factors across the year were then used to produce a new synthetic solar irradiance data set with the same characteristics as the measured solar irradiance data.
Histograms of the atmospheric attenuation factors, and the rate of change, were produced (see above) so as to show the characteristics of the clouds for the whole year.
Using an initial set of random numbers, a random walk algorithm using a statistical distribution resembling the real attenuation factors and their rates of change allowed for the creation of any arbitrary set of Sun irradiance values. Such values, on average, showed similar characteristics to the real attenuation factors, as well as their rate of change. The synthetic model was able to accept different random number generator seeds as input, to allow for the same randomly generated data to be reproduced as required.
Final Solar Model
The synthetic solar irradiance model was applied to five regions of Great Britain, using their respective coordinates as inputs to the 'clear sky' model and using a different random number generator seed for each:
- Cardiff (51.485018N, -3.179569E)
- Glasgow (55.871811N, -4.291798E)
- Southampton (50.914939N, -1.402187E)
- Sheffield (53.384762N, -1.471195E)
- London (51.516434N, -0.126457E)
Finally, the generated irradiance values for each time step were multiplied by a scaling factor (similar to the way it was applied to the wind data) to make it represent 50% of the total year's demand.
Combined 100% Renewable Grid Model
The time series for each of the demand, wind and solar models were combined within one matrix, with one column designated as the time vector. Therefore, for each 15 minute interval across the year, there exists estimated values for the electricity demand, wind production and solar production for that period.
Results
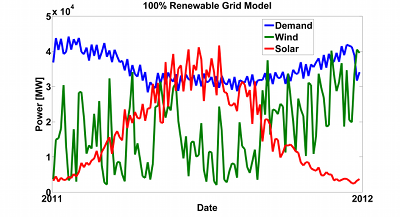
Plot of demand, wind and solar power across the full dataset, with each point representing a 3 day average. Solar production peaks in the summer, while demand peaks in the winter. Wind varies substantially across the whole year.
The scaling factors used to make the wind and solar production large enough to cover demand scale well enough so as to only leave 2.3kJ of demand 'unsupplied'. This is perhaps due to the precision of the variables used during the scaling mathematical operation. Contrast this to the total energy demand for the year of 1.1×10¹⁸J.
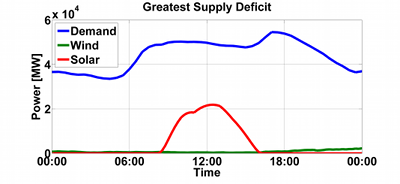
Plot of the day in which the greatest supply deficit occurs. The supply deficit (53.8GW) is almost as large as the demand at that point in time (54.5GW). This is because the Sun has gone down, resulting in a lack of solar production, and the wind production being very low due to a large scale weather system.
The minimum supply deficit occurs on 17th July at 12:00. At this point in time, high wind and midday sunshine provides a power deficit of -150.5GW, i.e. a surplus. The midsummer day coincides with clear skies and high winds, resulting in high power generation and low power consumption.
The challenge for a future grid is to somehow find a way of using the surplus to cover the deficits...
Potential Improvements
The data set is by no means fully representative of reality. Here are some potential improvements that could be made to the data in the future:
- Currently, the model does not account for ambient light from light sources at night such as moonlight. Solar production after the Sun has dropped below the horizon is zero by design. A small contribution could be made by the moon, the effect of which is currently unaccounted for.
- The dataset uses a resolution of 15 minutes. This is high enough to witness large scale fluctuations from weather events, night and day, morning and evening and so on, but it is too large to accurately resolve quick fluctuations such as those that exist with TV pickups. An increase of the resolution of the data set would involve the acquisition of higher resolution data from the Met Office, the National Grid and EirGrid.
Footnotes
- D.J.C. MacKay. Sustainable Energy - Without the Hot Air. UIT, 2009. ISBN: 9780954452933. Also available for free online.
- Ian Richardson, Murray Thomson, David Infield, Conor Clifford. Domestic electricity use: A high-resolution energy demand model, Energy and Buildings, Volume 42, Issue 10, October 2010, Pages 1878-1887, ISSN 0378-7788, DOI: 10.1016/j.enbuild.2010.05.023.

